
Inside View: Mapping a Cluster
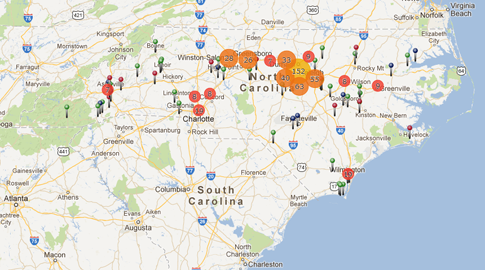 |
| Sample of cluster map for North Carolina's Bioscience companies, courtesy of Boriana Ditcheva. |
I've always been a visual person.
When I'm explaining something, I have to draw boxes to represent each point. This has no visual value, but I think it helps me compartmentalize an idea.
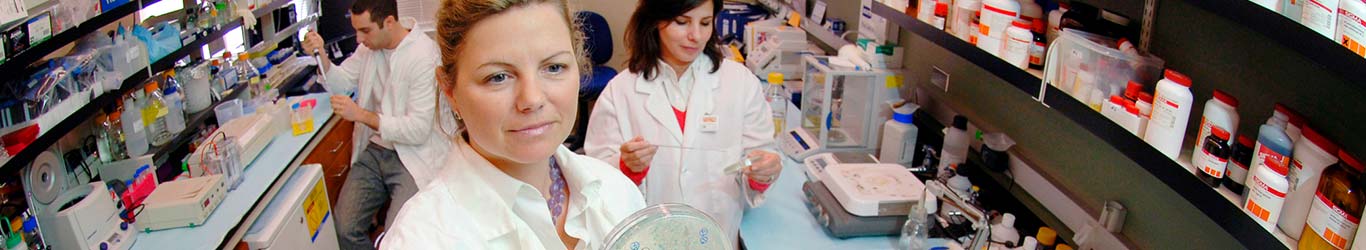
And when you're talking about biotechnology, it helps to give people something to look at. Team Communications at NCBiotech has been working on this - a lot - for the last three years. Simplifying biotechnology, using visuals to make it accessible, and showing its impact on the state.
So we were thrilled when Boriana, our Drupal (web system) developer, started working on a project to map the state's bioscience companies. All 580-plus sites.
The result looks like a cluster map. There are pins for each company. There are larger circles for areas where multiple companies do business. You can zoom in and zoom out. You can focus on a particular city or region.
That in itself is a pretty neat addition to our website. But we found out this week it's a pretty neat addition to the Drupal community. The code that Boriana used to create a custom function for our data is now included in the overall distribution of this module. With her name!
More recognition of the smart, talented people we have building the biotech industry for North Carolina.